What the instrument returned
Every figure the repositories render, and the journeys.
Artifacts
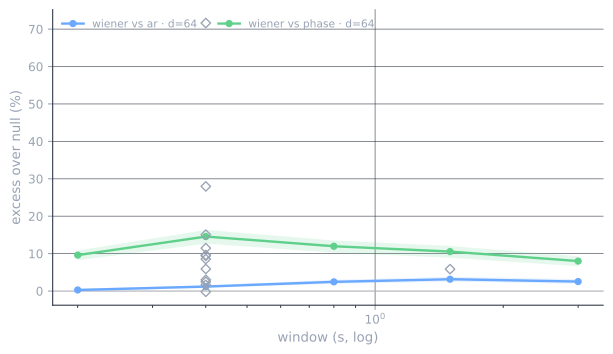
Q1: how much more a stretch of movement recurs across animals than a fitted null predicts, at each window length tried. Colored lines are the corpus against two null models; the gray diamonds are single-point sanity checks, sitting at zero.
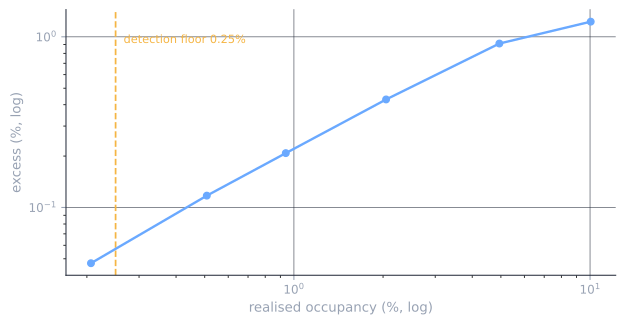
How the excess above scales with the amount of real repeated motif planted into the data — the ruler that turns an abstract excess into “this share of frames looks like a shared motif.”
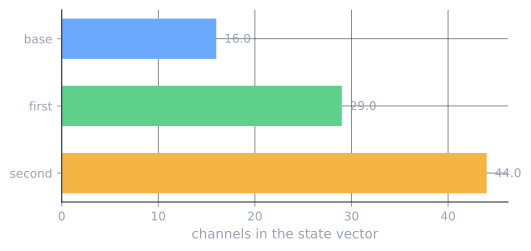
How many numbers describe one frame of movement, built up in stages from a 16-channel base (shape, size, body-frame velocity).
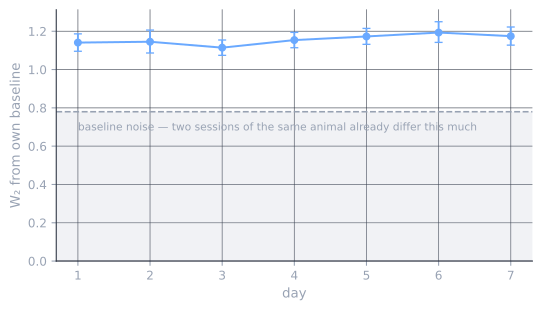
How far an animal's behavior sits from its own first-day baseline, tracked across the days of the protocol.
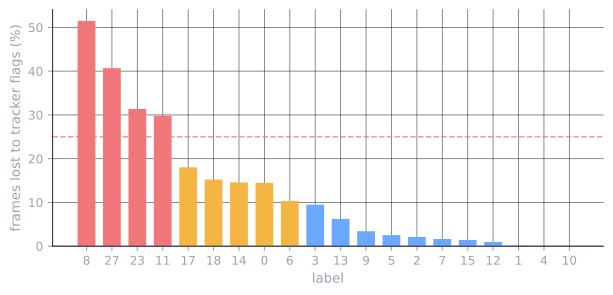
What share of each label's frames the tracker itself flagged as unreliable — the raw material the tracking-artifact audit is built on.
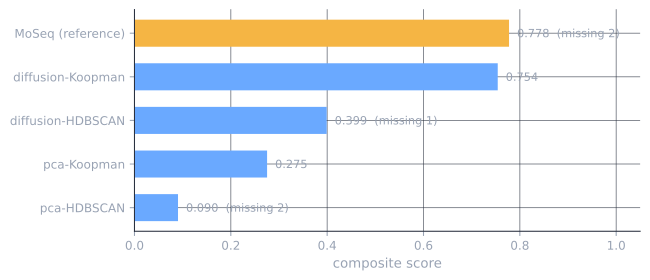
Five unsupervised clustering setups, scored on the same corpus by the same composite metric. They land far apart, and nothing here says which is right — why this site validates a labeller instead of picking one.
Journeys
+0.1067[+0.0783, +0.1373]provisional
context contrast, frame occupancy
+0.0245
the same contrast on bout rate
NOT_A_RESULT
the day-0 scalar
refused, and says why
What moves with context is how long behaviours are held, not how often they start.
Learning curve
Every MDE gate passes before the slope is read: the design had power to see a quarter of a plausible effect, on both occupancy arms.
gate: PASS, for every row below.
| measure | MDE / day | plausible effect |
|---|---|---|
| discrimination (frame) | 0.0379 | 0.1949 |
| discrimination (bout) | 0.1396 | 0.5910 |
| stabilisation (frame) | 0.0359 | 0.1949 |
| stabilisation (bout) | 0.1383 | 0.5910 |
And every group-level slope is null — both measures, both occupancy arms agree, which is the opposite of the Journeys section above: there, frame and bout occupancy split.
verdict: FAIL, for every row below.
| measure | mean slope / day | 95% CI | p |
|---|---|---|---|
| discrimination (frame) | +0.0096 | [-0.0189, +0.0397] | 0.429 |
| discrimination (bout) | +0.0341 | [-0.0838, +0.1484] | 0.480 |
| stabilisation (frame) | -0.0234 | [-0.0485, +0.0026] | 0.0475 |
| stabilisation (bout) | -0.0252 | [-0.1265, +0.0755] | 0.6035 |
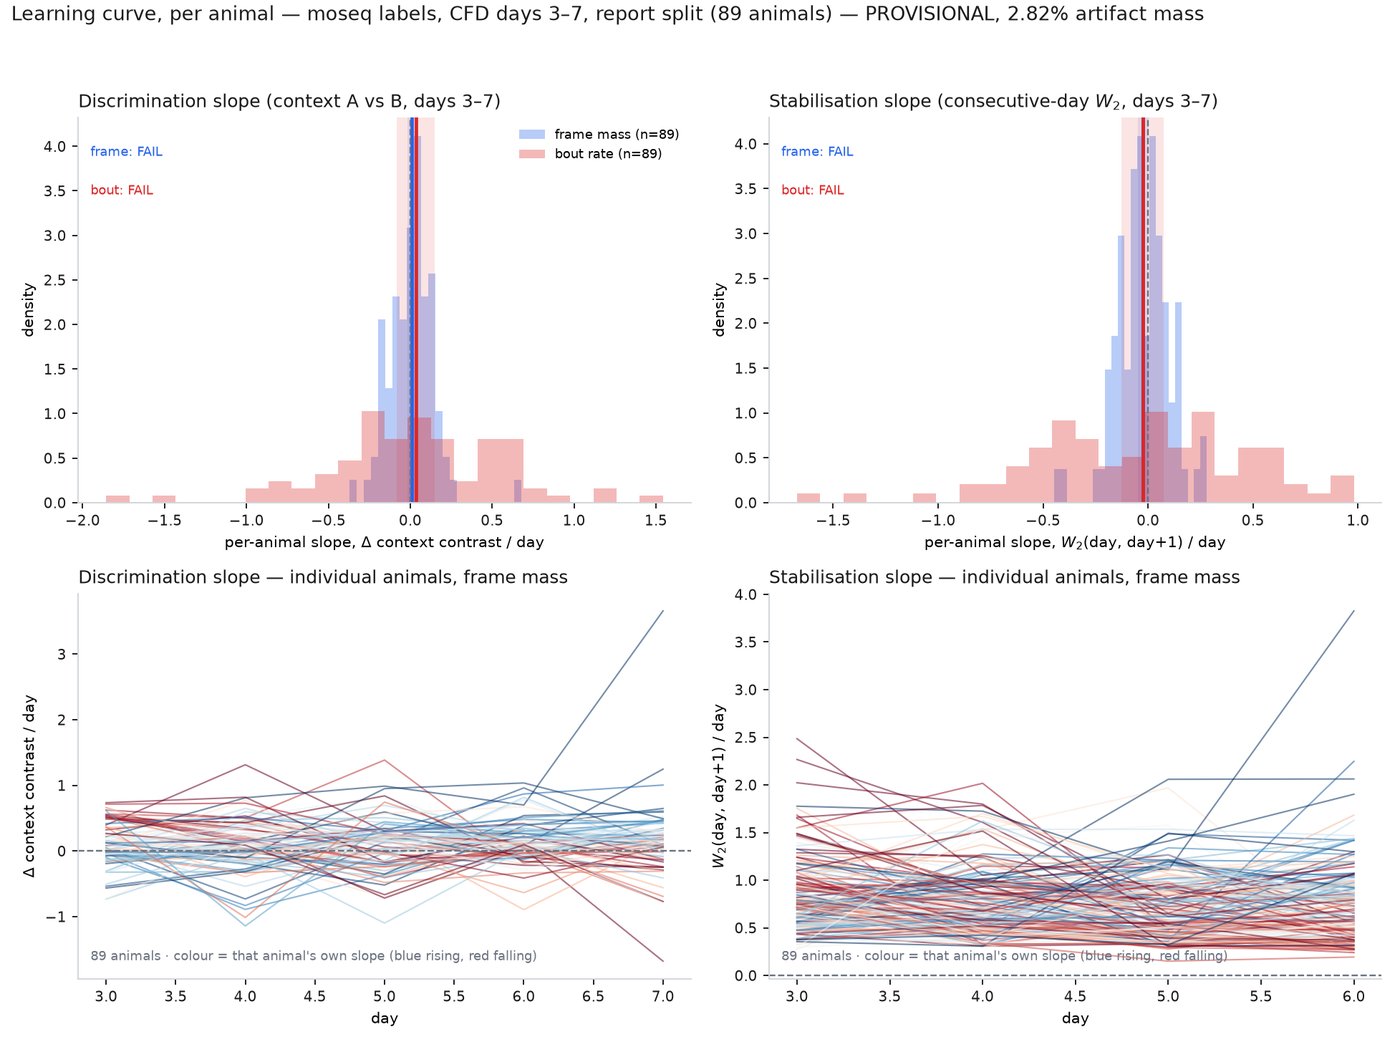
1.048
discrimination (frame) peak-to-peak
[-0.370, 0.677]
3.400
discrimination (bout) peak-to-peak
[-1.857, 1.543]
0.725
stabilisation (frame) peak-to-peak
[-0.446, 0.280]
2.653
stabilisation (bout) peak-to-peak
[-1.672, 0.981]
89 report-split animals, CFD days 3–7, MoSeq's unrestricted arm (2.82% artifact mass, same caveat as everything else MoSeq-labelled here). Provisional on the four-gate re-run. Per-animal values: results/per_animal_slopes.csv.